
Power BI Portfolio in Sri Lanka: Build a Useful Dashboard
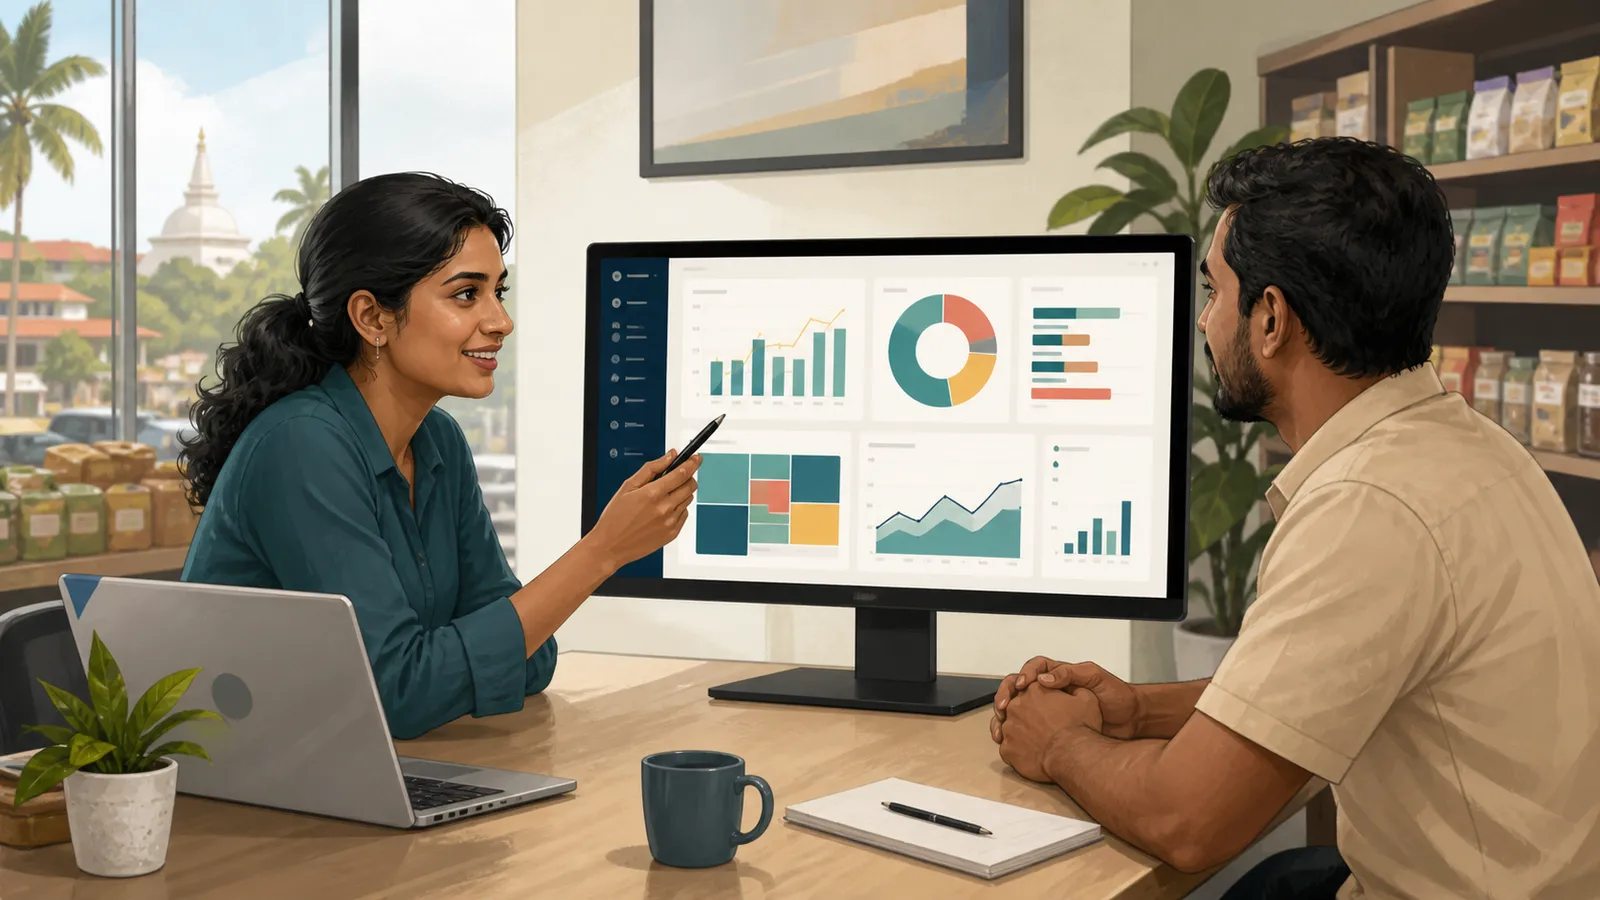
A Power BI portfolio in Sri Lanka should explain a business decision and show that the data model supports it. A colourful dashboard is only the visible layer. The underlying row meaning, relationships and measures determine whether the numbers are useful.
Use fictional shop data so the project can be shared without exposing customer or employer information.
Define the question and grain
Choose a question such as “How do sales differ by product category and month?” State that each sales row represents one order line.
Create separate product and date information where appropriate. Microsoft's star-schema guidance explains the distinction between fact tables used for summarisation and dimension tables used for filtering and grouping.
Keep the first model small enough to understand. More tables are not automatically evidence of a better design.
Plan the model
| Table | Purpose |
|---|---|
| Sales | Fictional order lines, quantities and amounts |
| Products | Unique product codes and categories |
| Dates | Calendar attributes used for time filtering |
Check that the key on the “one” side of a relationship is actually unique. Duplicate product records can lead to incorrect totals or relationship problems.
Document missing values and how returns are represented. Do not hide those choices behind a chart.
Build measures from verified definitions
Define sales, order count and any other measures in plain language first. If the data stores order lines, counting rows is not the same as counting distinct orders.
Verify a small subset by hand. For example, two fictional lines of LKR 1,200 and LKR 800 should contribute LKR 2,000 before any separately defined adjustments.
Check the same measure with and without filters. A result that changes unexpectedly may reveal a relationship or calculation issue.
Design a focused report page
Use a few visuals that answer the question: a monthly trend, category comparison and a table for detailed inspection.
Label the date range, currency and dataset as fictional. Avoid decorative indicators that imply a target or benchmark you have not defined.
Include an exception or data-quality note when it affects interpretation. A reviewer should understand what the report cannot establish as well as what it shows.
Share the portfolio appropriately
Provide screenshots, a walkthrough and the model explanation. If you publish an interactive report, understand the sharing method.
Microsoft's Publish to web guidance warns that this option makes the report publicly accessible and can expose underlying model data. Use only information that is appropriate for public release.
Do not treat a hidden visual as protection for confidential data. Review the actual dataset and sharing settings before publishing.
Explain the decisions in the case study
Write about the question, source data, model, measures, validation and findings. Include one issue you discovered and how you resolved it.
A useful limitation might be that the fictional dataset contains revenue but no product costs, so the report cannot establish profitability.
End with a next step that follows from the evidence, such as adding a defined cost source or checking data completeness.
Do you need a complex dashboard?
No. A clear page with trustworthy measures can demonstrate more skill than many visuals without a coherent question.
Can you use employer data if names are removed?
Only with the appropriate permission. Removing names may not make business data safe to publish.
What should an interviewer be able to inspect?
The table relationships, measure definitions and a calculation traced back to sample rows.
What makes the project different from a screenshot?
A reproducible model, documented assumptions and verified results show how the report was built and why it can be trusted within its stated limits.
Related guides
- No-Code Automation in Sri Lanka: Plan Your First Workflow
- Cybersecurity Portfolio in Sri Lanka: A Safe First Project
- Git for Team Projects: A Sri Lanka Beginner Guide
Browse the Sri Lanka work and technology guides for more practical application, AI and workplace projects.
Related articles


About the author
App Dev Sri Lanka prepared this guide with AI assistance, original examples and the linked primary sources. The collection was informed by Google Trends research for Sri Lanka on 2 September 2026. Illustrations depict fictional people. Examples are educational; this article is not a live vacancy notice or an employer endorsement.
Learn more about App Dev Sri Lanka