
Data Analyst Portfolio in Sri Lanka: Sales Project Guide

A data analyst portfolio in Sri Lanka should answer a business question and show how you checked the data. A polished dashboard alone does not explain whether the numbers are trustworthy.
Build a fictional shop-sales project so you can publish the complete dataset, calculations and conclusions without exposing customer information.
Start with a decision
Choose a question such as “Which product categories contributed most to sales during the sample period?” Define what a row represents: one order line, one order or one daily total.
This choice affects every calculation. If an order has several lines, counting rows does not count orders.
Write a short data dictionary describing dates, product codes, quantities, prices and returned items. Use consistent units and make the currency explicit.
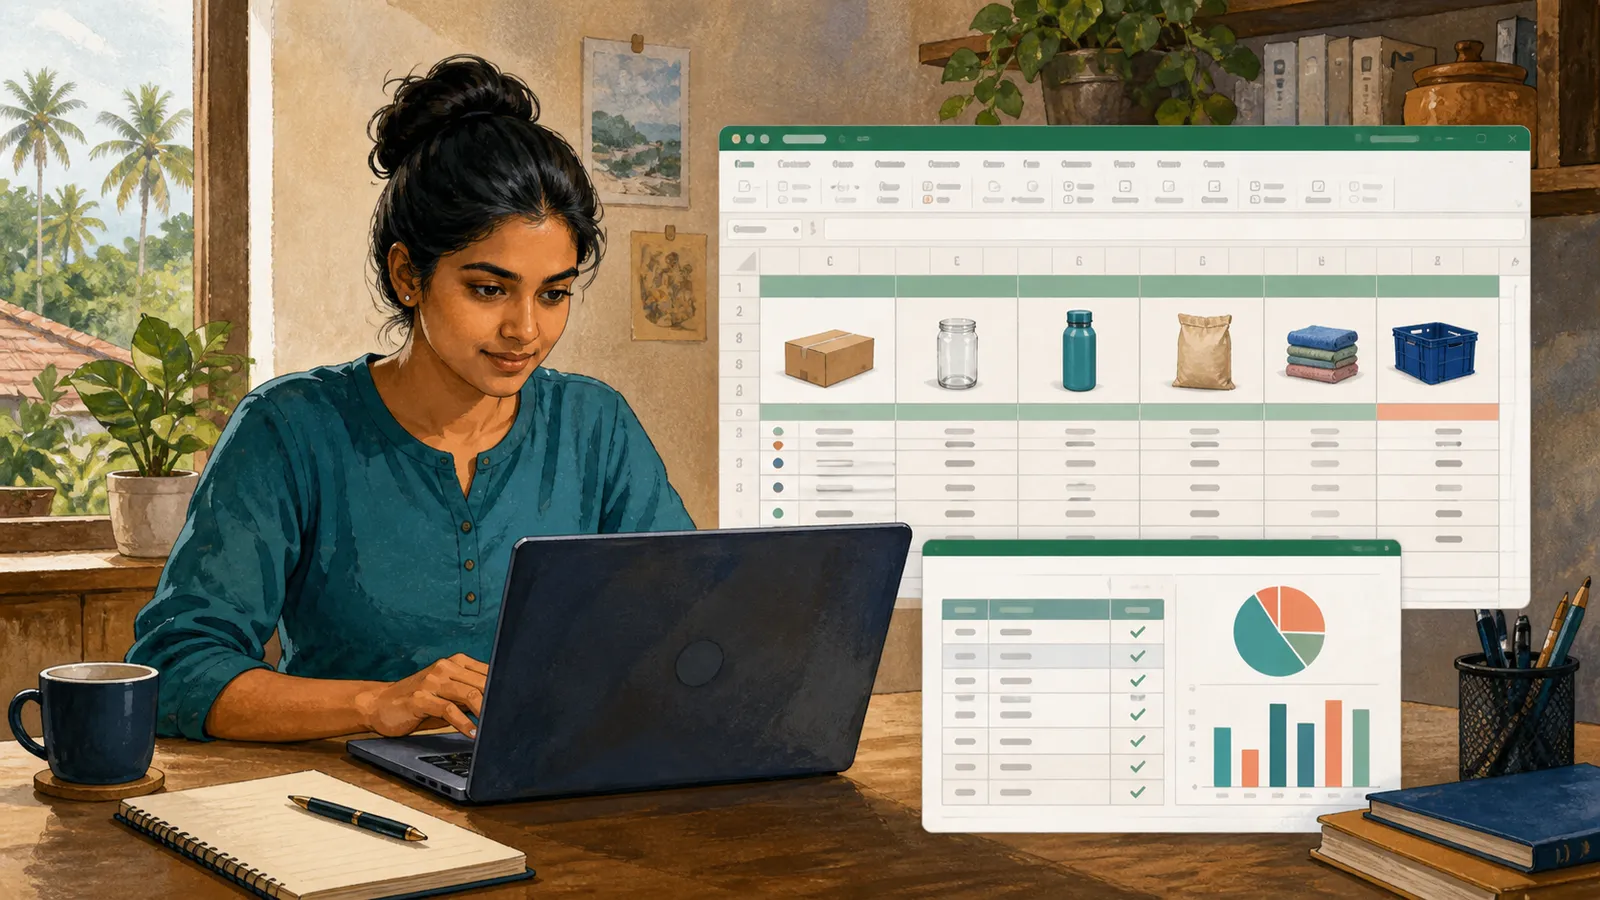
Create and inspect the sample data
| Check | Why it matters |
|---|---|
| Repeated order-line IDs | Can double-count sales |
| Missing product codes | Can break category mapping |
| Text in numeric columns | Can hide failed calculations |
| Returns and cancellations | Change the meaning of revenue |
| Different date formats | Can put records in the wrong period |
Keep an untouched source copy and document cleaning decisions. Do not simply delete inconvenient rows without explaining why.
If you use publicly available data instead of fictional data, record the source, licence and limitations before publishing it.
Build calculations you can explain
For a fictional line with quantity three and unit price LKR 400, gross line sales are LKR 1,200 before any specified discount or return treatment. Define those adjustments separately.
Use a small hand-calculated sample to check your code or spreadsheet. A total that looks plausible is not enough.
If you join product information to order lines, check whether each product code appears once in the lookup table. Duplicate lookup rows can multiply results. The PostgreSQL joins tutorial explains the underlying join behaviour.
Present findings with limits
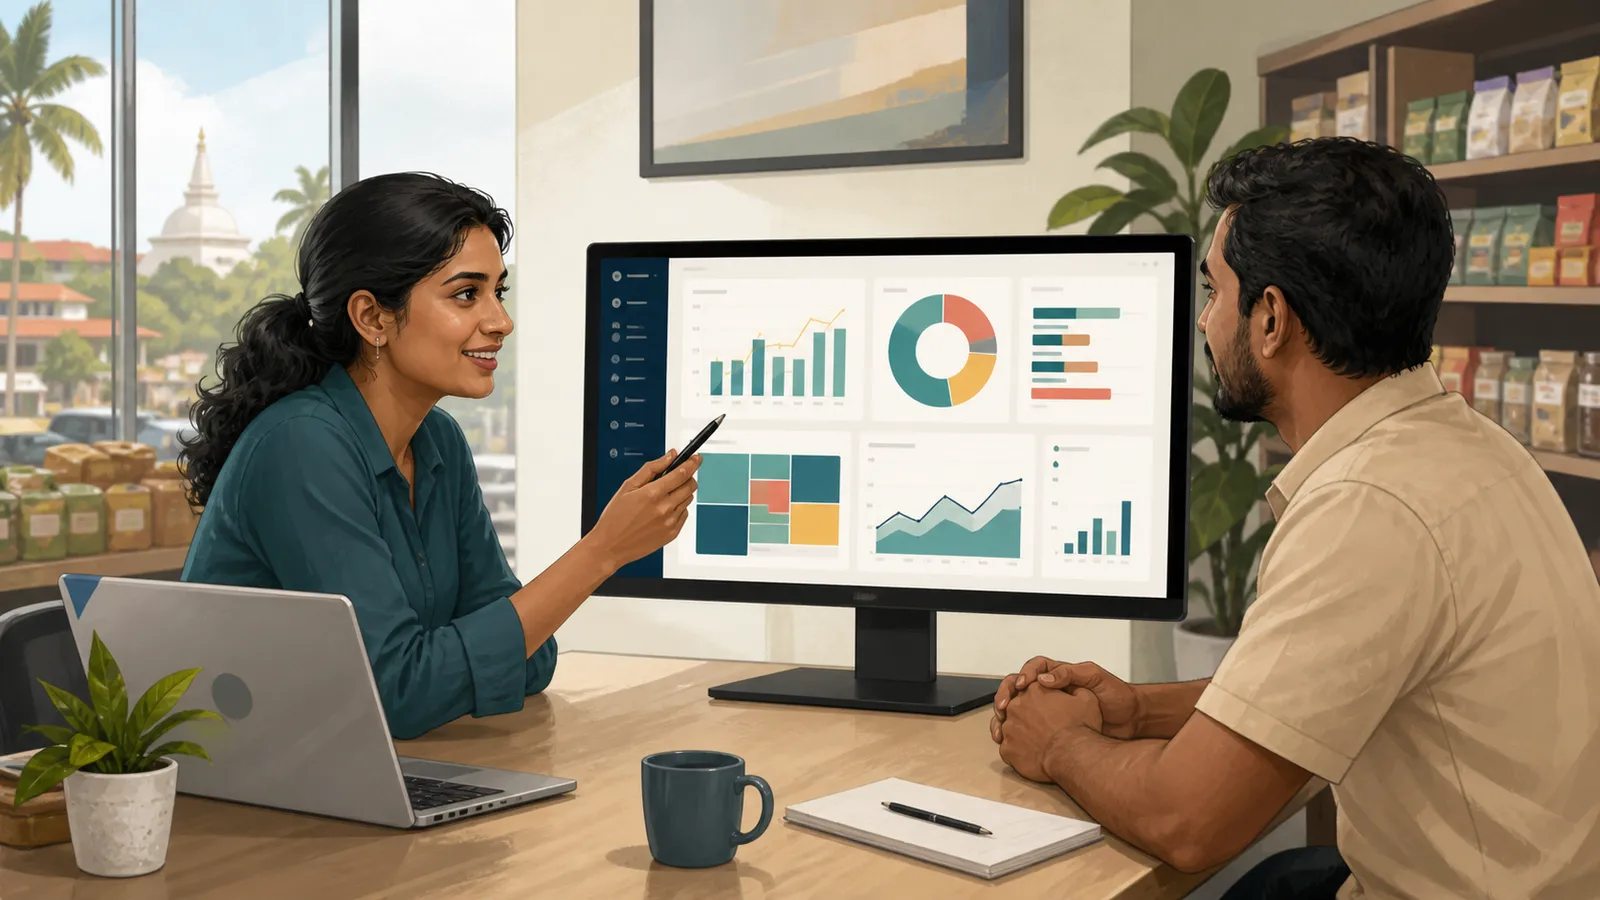
Choose a few visuals that answer the original question: category totals, a period trend and a table of exceptions may be enough.
State the date range and whether the data is fictional. Do not present the exercise as evidence of Sri Lankan consumer behaviour or a real shop's performance.
A useful conclusion might be: “In this fictional sample, category A has the highest recorded sales, but missing product mappings prevent a complete category comparison.” That connects the finding to the data quality.
Write the case study
Explain the question, dataset, cleaning decisions, calculations and result. Include one issue you discovered and how you checked it.
Keep screenshots readable and link the working files where appropriate. A reviewer should be able to trace a displayed number back to the source rows.
End with the next business question you would investigate, such as whether high sales also produce high margin. Do not claim to answer margin questions when the dataset has no cost information.
Should you use Excel, SQL or Python?
Choose tools that fit the task and the roles you are targeting. A transparent analysis in one tool is more useful than unnecessary complexity across several.
Can a fictional dataset be credible?
Yes, when it is clearly labelled and the analysis demonstrates real methods. It should not be presented as a survey or a real company's confidential data.
What if the result is not surprising?
A correct, useful answer is enough. The portfolio should demonstrate judgement and reliability rather than manufacture a dramatic finding.
What should an interviewer be able to ask you?
They should be able to ask about row meaning, missing values, joins and the calculation behind any chart. Prepare to explain those choices in plain language.
Related guides
- SQL Interview Practice in Sri Lanka: Questions and Checks
- Power BI Portfolio in Sri Lanka: Build a Useful Dashboard
- Excel Skills for Jobs in Sri Lanka: A Practice Project
Browse the Sri Lanka work and technology guides for more practical application, AI and workplace projects.
Related articles

About the author
App Dev Sri Lanka prepared this guide with AI assistance, original examples and the linked primary sources. The collection was informed by Google Trends research for Sri Lanka on 2 September 2026. Illustrations depict fictional people. Examples are educational; this article is not a live vacancy notice or an employer endorsement.
Learn more about App Dev Sri Lanka